Resolving Segmentation Fault (“Core dumped”) in Ubuntu

This error may strike your ubuntu at any point of the moment. 
A few days ago when I was doing my routine work in my ubuntu laptop, suddenly
I encountered with an error “Segmentation fault ( core dumped)” then I got to know
that, this error can strike you ubuntu or any other operating system at any point of
the moment as binaries crashing doesn’t depend on us. Segmentation fault is when
your system tries to access a page of memory that doesn’t exist. Core dumped
means when a part of code tries to perform read and write operation on a read-only
or free location. Segfaults are generally associated with the file named core and It
generally happens during upgradation.


While running some commands during the core-dump situation you may encounter
with “ Unable to open Lock filethis is because the system is trying to capture a
bit block which is not existing, This is due to crashing of binaries of some specific
programs.
You may do backtracking or debugging to resolve it but the solution is to repair the
broken packages and we can do it by performing the below-mentioned steps:

Command-line:
Step 1: Remove the lock files present at different locations.
sudo rm -rf /var/lib/apt/lists/lock /var/cache/apt/archives/lock /var/lib/dpkg/lock and restart your system.
Step 2: Remove repository cache.
sudo apt-get clean all
Step 3: Update and upgrade your repository cache.
sudo apt-get update && sudo apt-get upgrade
Step 4: Now upgrade your distribution, it will update your packages.
sudo apt-get dist-upgrade
Step 5: Find the broken packages and delete it forcefully.
sudo dpkg -l | grep ^..r | apt-get purge
Apart from the command line the best way which will always work is:
Step 1: Run ubuntu in startup mode by pressing Esc key after restart.
Step 2: Select Advanced options for Ubuntu

Step 3: Run Ubuntu in the recovery mode and you will be listed with many options.


Step 4: First select “Repair broken packages”

Step 5: Then select “Resume normal boot”
So, we have two methods of resolving segmentation fault: CLI and the GUI.
Sometimes, it may also happen that “apt” command is not working because of
segfault, so our CLI method will not work, in that case also don’t
worry as GUI method gonna work for us always.

The closer you think you are, the less you’ll actually see

I hope you have seen the movie Now you see me, it has a famous quote The closer you think you are, the less you’ll actually see. Well, this blog is not about this movie but how I got stuck into an issue, because I was not paying attention and looking at the things closely and seeing less hence not able to resolve the issue.

There is a lot happening in today’s DevOps world. And HashiCorp has emerged out to be a big player in this game. Terraform is one of the open source tools to manage infrastructure as code. It plays well with most of the cloud provider. But with all these continuous improvements and enhancements there comes a possibility of issues as well. Below article is about such a scenario. And in case you have found yourself in the same trouble. You are lucky to reach the right page.

I was learning terraform and performing a simple task to launch an Ubuntu EC2 instance in us-east-1 region. For which I required the AMI Id, which I copied from the AWS console as shown in below screenshot.

Once I got the AMI Id, I tried to create the instance using terraform, below is the screenshot of the code

provider “aws” {
  region     = “us-east-1”
  access_key = “XXXXXXXXXXXXXXXXXX”
  secret_key = “XXXXXXXXXXXXXXXXXXX”
}
resource “aws_instance” “sandy” {
        ami = ami-036ede09922dadc9b
        instance_type = “t2.micro”
        subnet_id = “subnet-0bf4261d26b8dc3fc”
}
I was expecting to see the magic of Terraform but what I got below ugly error.

Terraform was not allowing to spin up the instance. I tried couple of things which didn’t work. As you can see the error message didn’t give too much information. Finally, I thought of giving it a try by  doing same task via AWS web console. I searched for the same ubuntu AMI and selected the image as shown below. Rest of the things, I kept to default. And well, this time it got launched.

And it confused me more. Through console, it was working fine but while using Terraform it says not allowed. After a lot of hair pulling finally, I found the culprit which is a perfect example of how overlooking small things can lead to blunder.

Culprit

While copying the AMI ID from AWS console, I had copied the 64-bit (ARM) AMI ID. Please look carefully, the below screenshot

But while creating it through console I was selecting the default configuration which by is 64-bit(x86). Look at the below screenshot.

To explain it further, I tried to launch the VM with 64-bit (ARM) manually. And while selecting the AMI, I selected the 64-bit (ARM).

And here is the culprit. 64-bit(ARM) only supports a1 instance type

Conclusion

While launching the instance with the terraform, I tried using 64-bit (ARM) AMI ID mistakenly, primarily because for same AMI there are 2 AMI IDs and it is not very visible to eyes unless you pay special attention.

So folks, next time choosing an AMI ID keep it in mind what type of AMI you are selecting. It will save you a lot of time.

Best Practices for Writing a Shell Script


I am a lazy DevOps Engineer. So whenever I came across the same task more than 2 times I automate that. Although now we have many automation tools, still the first thing that hit into our mind for automation is bash or shell script.
After making a lot of mistakes and messy scripts :), I am sharing my experiences for writing a good shell script which not only looks good but also it will reduce the chances of error.

The things that every code should have:-
     – A minimum effort in the modification.
     – Your program should talk in itself, so you don’t have to explain it.
     – Reusability, Of course, I can’t write the same kind of script or program again and again.

I am a firm believer in learning by doing. So let’s create a problem statement for ourselves and then try to solve it via shell scripting with best practices :). I would like to have solutions in the comment section of this blog.
Problem Statement:- Write a shell script to install and uninstall a package(vim) depending on the arguments. The script should tell if the package is already installed. If no argument is passed it should print the help page.

So without wasting time let’s start for writing an awesome shell script. Here is the list of things that should always be taken care of while writing a shell script.

Lifespan of Script

If your script is procedural(each subsequent steps relies on the previous step to complete), do me a favor and add set -e in starting of the script so that the script exists on the first error. For example:-


  #!/bin/bash
   
  set -e # Script exists on the first failure
  set -x # For debugging purpose

Functions

Ahha, Functions are my most favorite part of programming. There is a saying
 

Any fool can write code that a computer can understand. Good programmers write code that humans can understand. 

To achieve this always try to use functions and name them properly so that anyone can understand the function just by reading its name. Functions also provide the concept of re-usability. It also removes the duplicating of code, how? let’s see this


      #!/bin/bash
  install_package() {
  local PACKAGE_NAME=$1
  yum install ${PACKAGE_NAME} -y
  }
   
  install_package vim
 

Command Sanity

Usually, scripts call other scripts or binary. When we are dealing with commands there are chances that commands will not be available on all systems. So my suggestion is to check them before proceeding.
 
  #!/bin/bash
  check_package() {
  local PACKAGE_NAME=$1
  if ! command -v ${PACKAGE_NAME} > /dev/null 2>&1
  then
  printf ${PACKAGE_NAME} is not installed.\n
  else
  printf ${PACKAGE_NAME} is already installed.\n
  fi
  }
   
  check_package vim
 

Help Page

If you guys are familiar with Linux, you have certainly noticed that every Linux command has its help page. The same thing can be true for the script as well. It would be really helpful to include –help flag.
 
  #!/bin/bash
  INITIAL_PARAMS=$*
   
  help_function() {
  {
  printf Usage:- ./script \n
  printf Options:\n
  printf -a ==> Install all base softwares\n
  printf -r ==> Remove base softwares\n
  }
  }
   
  arg_checker() {
  if [ ${INITIAL_PARAMS} == –help ]; then
  help_function
  fi
  }
   
  arg_checker

Logging

Logging is the most critical thing for everyone whether he is a developer, sysadmin or DevOps. Debugging seems to be impossible without logs. As we know most applications generate logs for understanding that what is happening with the application, the same practice can be implemented for shell script as well. For generating logs we have a bash utility called logger.
 
  #!/bin/bash
  DATE=$(date)
   
  declare DATE
   
  check_file() {
  local FILENAME=$1
  if ! ls ${FILENAME} > /dev/null 2>&1
  then
  logger -s ${DATE}: ${FILENAME} doesn’t exists
  else
  logger -s ${DATE}: ${FILENAME} found successfuly
  fi
  }
   
  check_file /etc/passwd

Variables

I like to name my variables in Capital letters with an underscore, In this way, I will not get confused with the function name and variable name. Never give a,b,c etc. as a variable name instead of that try to give a proper name to a variable as well just like functions.
 
  #!/bin/bash
  # Use declare for declaring global variables
  declare GLOBAL_MESSAGE=Hey, I am a global message
   
  # Use local for declaring local variables inside the function
  message_print() {
  local LOCAL_MESSAGE=Hey, I am a local message
  printf Global Message:- ${GLOBAL_MESSAGE}\n
  printf Local Message:- ${LOCAL_MESSAGE}\n
  }
   
  message_print

Cases

Cases are also a fascinating part of shell script. But the question is when to use this? According to me if your shell program is providing more than one functionality basis on the arguments then you should go for cases. For example:- If your shell utility provides the capability of installing and uninstalling the software.
 
  #!/bin/bash
  print_message() {
  MESSAGE=$1
  echo ${MESSAGE}
  }
   
  case $1 in
  -i|–input)
  print_message Input Message
  ;;
  -o|–output)
  print_message Output Message
  ;;
  –debug)
  print_message Debug Message
  ;;
  *)
  print_message Wrong Input
  ;;
  esac
 
In this blog, we have covered functions, variables, the lifespan of a script, logging, help page, command sanity. 
I hope these topics help you in your daily life while using the shell script. If you have any feedback please let me know through comments.
 
Cheers Till the next Time!!!!


Can you integrate a GitHub Webhook with Privately hosted Jenkins No? Think again

Introduction

One of the most basic requirement of CI implementation using Jenkins is to automatically trigger a Jenkins job post every commit. As you are already aware there are two ways in which a Jenkins job can be triggered in an automated fashion is:
  • Pull | PollSCM
  • Push | Webhook
It is a no-brainer that a Push-based trigger is the most efficient way of triggering a Jenkins job else you would be unnecessarily hogging your resources. One of the hurdles in implementing a push-based trigger is that your VCS & Jenkins server should be in the same network or in simple terms they can talk to each other.
In a typical CI setup, there is a SAAS VCS i.e GitHub/GitLab and a privately hosted Jenkins server, which make a Push-based triggering of Jenkins job impossible. Till a few days back I was under the same impression until I found this awesome blog that talks about how you can integrate a Webhook with your private Jenkins server.
In this blog, I’ll be trying to explain how I implemented the Webhook relay. Most importantly the reference blog was about integration of WebhookRelay with GitHub, with GitLab still there were some unexplored areas and I faced some challenges while doing the integration. This motivated me to write a blog so that people will have a ready reference on how to integrate GitLab with Webhook Relay.

Overall Workflow

Step 1: Download WebHook Relay Agent on the local system

Copy and execute the command

curl -sSL https://storage.googleapis.com/webhookrelay/downloads/relay-linux-amd64 > relay && chmod +wx relay && sudo mv relay /usr/local/bin
Note: Webhook Relay and Webhook Relay agent are different. Webhook Relay is running on public IP which triggers by GitLab and Webhook Relay Agent is a service which gets trigger by Webhook relay.

Step 2: Create a Webhook Relay Account

After successfully signing up we will land on Webhook Relay home page.

Step 3: Setting up the Webhook Relay Agent.

We have to create Access Tokens.

Now after navigating through Access token, click on Create Token button. Then we are provided with a Key and Secret pair.

Copy and execute:

relay login -k token-key -s token-secret


If it prompts a success message it means our Webhook relay agent is successfully setup.

Step 4: Create GItLab Repository

We will keep our repository a public one to keep things simple and understandable. Let’s say our Gitlab repository’s name is  WebhookProject.

Step 5: Install GitLab and GitLab Hook Plugin.

Go to Manage Jenkins →  Manage Plugins → Available


Step 6: Create Jenkins Job


Configure job: Add Gitlab repository link

Now we’ll choose the build trigger option:


Save the job.

Step 7: Connecting GitLab Repository, Webhook Relay, and Webhook Relay Agent

The final and most important step is to Connect the Overall flow.
Start forwarding Webhooks to Jenkins
Open terminal and type command:

relay forward --bucket gitlab-jenkins http://localhost:8080/project/webhook-gitlab-test
Note: Bucket name can be anything


Note: Do not stop this process by doing (ctrl+c).Open a new terminal or a new tab for commit to gitlab.
The most critical part of the workflow is the link generated by the Webhook Relay Agent. Copy this link and paste Gitlab repository(webhookProject) → Settings → Integrations

Paste the link.

For the sake of simplicity uncheck the Enable SSL Verification and click Add webhook button

Until now all major configuration has been done. Now Clone GitLab repository and push commits to the remote repository.
Go to Jenkins job and see build is triggered by GitLab webhook.
To see GitLab webhook Relay Logs, Go to :
Gitlab Repository → Settings → Integrations → webhook → Edit


To see Logs of Webhook Relay Agent trigger Jenkins, Go to:
Webhook Relay UI page → Relay Logs.

So now you know how to do WebHook integration between your VCS & Jenkins even when they are not directly reachable to each other.
Can you integrate a GitHub Webhook with Privately hosted Jenkins? Yes
Cheers Till Next Time!!!!


Data Migration Service – AWS DMS

Data migration between various platforms. 

Have you ever thought about migrating your production database from one platform to another and dropped this idea later, because it was too risky, you were not ready to bare a downtime?

If yes, then please pay attention because this is what we are going to perform in this article. 
A few days back we’re trying to migrate our production MySQL RDS from AWS to GCP SQL, and we had to migrate data without downtime, accurate and real-time and that too without the help
of any Database Administrator.
After doing a bit research and evaluating few services we finally started working on AWS DMS 
(Data Migration Service) and figured out this is a great service to migrate a different kind of data. 

Let’s discuss some important features of AWS DMS: 

  • The source database remains fully operational during the migration.
  • Migrates the database securely, quickly and accurately.
  • No downtime required works as schema converter as well.
  • Supports various type or database like MySQL, MongoDB, PSQL etc.
  • Migrates real-time data also synchronize ongoing changes. 
  • Homogeneous migrations (migrations between the same engine types).
  • Heterogeneous migrations (migrations between different engine types).
  • Compatible with a long range of database platforms like RDS, Google SQL, on-premises etc. 
  • Inexpensive (Pricing is based on the compute resources used during the migration process).
This is a high-level overview of Data Migration Setup.

Let’s perform step by step migration: 

Note: We’ve performed migration from AWS RDS to GCP SQL, you can choose database source and destination as per your requirement. 

Create replication instance:

A replication instance initiates the connection between the source and target databases, transfers the data, cache any changes that occur on the source database during the initial data load.
Use the fields to below to configure the parameters of your new replication instance including network and security information, encryption details, select instance class as per requirement.
After completing all mandatory fields click the next tab, and you will be redirected to Replication Instance tab. Grab a coffee quickly while the instance is getting ready.
Hope you are ready with your coffee because the instance is ready now.

Now let’s create two endpoints “Source” and “Target”:

Click on “Run test” tab after completing all fields, make sure your Replication instance IP is whitelisted under security group. 

Create Target Endpoint:


Click on “Run test” tab again after completing all fields, make sure your replication instance IP is whitelisted under target DB authorization. 
Our replication setup is ready now, we’ve to create “Replication Task” to perform the migration. 

Create a “Replication Task” to start replication:

  • Task Name: any name
  • Replication Instance: The instance we’ve created above
  • Source Endpoint: The source database
  • Target Endpoint: The target database
  • Migration Type: Here I choose “Migrate existing data and replicate ongoing” because we needed ongoing changes.

Once all the fields are completed click on the “Create task” and you will be redirected to “Tasks” tab.

Verify the task status:

The task status is “Load Complete” and Validation Status is “Validated” that means migration has been performed successfully. 

AlertManager Integration with Prometheus

One day I got a call from one of my friend and he said to me that he is facing difficulties while setting up AlertManager with Prometheus. Then, I observed that most of the people face such issues while establishing a connection between AlertManager and receiver such as E-mail, Slack etc.
From there, I got motivation for writing this blog so AlertManager setup with Prometheus will be a piece of cake for everyone.
If you are new to AlertManager I would suggest you go through with our Prometheus blog.

What Actually AlertManager Is?

AlertManager is used to handle alerts for client applications (like Prometheus). It also takes care of alerts deduplicating, grouping and then routes them to different receivers such as E-mail, Slack, Pager Duty.
In this blog, we will only discuss on Slack and E-mail receivers.
AlertManager can be configured via command-line flags and configuration file. While command line flags configure system parameters for AlertManager,  the configuration file defines inhibition rules, notification routing, and notification receivers.

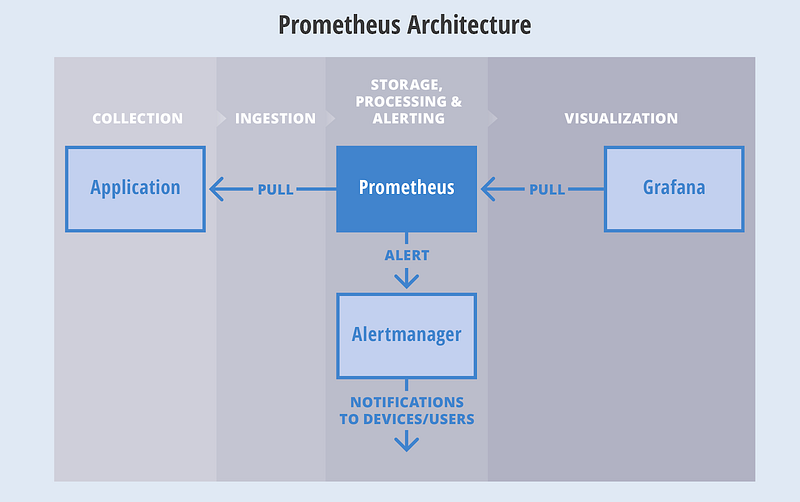
Architecture

Here is a basic architecture of AlertManager with Prometheus.
This is how Prometheus architecture works:-

  • If you see in the above picture Prometheus is scraping the metrics from its client application(exporters).
  • When the alert is generated then it pushes it to the AlertManager, later AlertManager validates the alerts groups on the basis of labels.
  • and then forward it to the receivers like Email or Slack.
If you want to use a single AlertManager for multiple Prometheus server you can also do that. Then architecture will look like this:-

Installation

Installation part of AlertManager is not a fancy thing, we just simply need to download the latest binary of AlertManager from here.
$ cd /opt/
$ wget https://github.com/prometheus/alertmanager/releases/download/v0.11.0/alertmanager-0.11.0.linux-amd64.tar.gz
After downloading, let’s extract the files.
$ tar -xvzf alertmanager-0.11.0.linux-amd64.tar.gz
So we can start AlertManager from here as well but it is always a good practice to follow Linux directory structure.
$ mv alertmanager-0.11.0.linux-amd64/alertmanager /usr/local/bin/

 Configuration

Once the tar file is extracted and binary file is placed at the right location then the configuration part will come. Although AlertManager extracted directory contains the configuration file as well but it is not of our use. So we will create our own configuration. Let’s start by creating a directory for configuration.
$ mkdir /etc/alertmanager/
Then the configuration file will take place.
$ vim /etc/alertmanager/alertmanager.yml
The configuration file for Slack will look like this:-
global:


# The directory from which notification templates are read.
templates:
- '/etc/alertmanager/template/*.tmpl'

# The root route on which each incoming alert enters.
route:
# The labels by which incoming alerts are grouped together. For example,
# multiple alerts coming in for cluster=A and alertname=LatencyHigh would
# be batched into a single group.
group_by: ['alertname', 'cluster', 'service']

# When a new group of alerts is created by an incoming alert, wait at
# least 'group_wait' to send the initial notification.
# This way ensures that you get multiple alerts for the same group that start
# firing shortly after another are batched together on the first
# notification.
group_wait: 3s

# When the first notification was sent, wait 'group_interval' to send a batch
# of new alerts that started firing for that group.
group_interval: 5s

# If an alert has successfully been sent, wait 'repeat_interval' to
# resend them.
repeat_interval: 1m

# A default receiver
receiver: mail-receiver

# All the above attributes are inherited by all child routes and can
# overwritten on each.

# The child route trees.
routes:
- match:
service: node
receiver: mail-receiver

routes:
- match:
severity: critical
receiver: critical-mail-receiver

# This route handles all alerts coming from a database service. If there's
# no team to handle it, it defaults to the DB team.
- match:
service: database
receiver: mail-receiver
routes:
- match:
severity: critical
receiver: critical-mail-receiver

receivers:
- name: 'mail-receiver'
slack_configs:

- api_url: https://hooks.slack.com/services/T2AGPFQ9X/B94D2LHHD/jskljaganauheajao2

channel: '#prom-alert'

- name: 'critical-mail-receiver'
slack_configs:

- api_url: https://hooks.slack.com/services/T2AGPFQ9X/B94D2LHHD/abhajkaKajKaALALOPaaaJk

channel: '#prom-alert'

You just have to replace the channel name and api_url of the Slack with your information.
The configuration file for E-mail will look something like this:-
global:

templates:
- '/etc/alertmanager/*.tmpl'
# The root route on which each incoming alert enters.
route:
# default route if none match
receiver: alert-emailer

# The labels by which incoming alerts are grouped together. For example,
# multiple alerts coming in for cluster=A and alertname=LatencyHigh would
# be batched into a single group.
# TODO:
group_by: ['alertname', 'priority']

# All the above attributes are inherited by all child routes and can
# overwritten on each.

receivers:
- name: alert-emailer
email_configs:
- to: 'receiver@example.com'
send_resolved: false
from: 'sender@example.com'
smarthost: 'smtp.example.com:587'
auth_username: 'sender@example.com'
auth_password: 'IamPassword'
auth_secret: 'sender@example.com'
auth_identity: 'sender@example.com'

In this configuration file, you need to update the sender and receiver mail details and the authorization password of the sender.
Once the configuration part is done we just have to create a storage directory where AlertManger will store its data.
$ mkdir /var/lib/alertmanager
Then only last piece which will be remaining is my favorite part i.e creating service 🙂
$ vi /etc/systemd/system/alertmanager.service
The service file will look like this:-
[Unit]
Description=AlertManager Server Service
Wants=network-online.target
After=network-online.target

[Service]
User=root
Group=root
Type=Simple
ExecStart=/usr/local/bin/alertmanager \
--config.file /etc/alertmanager/alertmanager.yml \

--storage.tsdb.path /var/lib/alertmanager

[Install]
WantedBy=multi-user.target
Then reload the daemon and start the service
$ systemctl daemon-reload
$ systemctl start alertmanager
$ systemctl enable alertmanager
Now you are all set to fire up your monitoring and alerting. So just take a beer and relax until AlertManager notifies you for alerts. All the best!!!!

Its not you Everytime, sometimes issue might be at AWS End

Today an issue reported to me that website of our client was loading very slow which was hosted on AWS Windows server and the same website was loading fine when accessed from outside AWS network,I just felt like might be a regular issue but it all together took me to an inside out of the network troubleshooting.

Initially, we checked for SSL certificate expiry, which was not the case, so below are the Two steps which we used to troubleshoot the issue:

Troubleshooting through Browser via Web developer Network tool

In browser we checked which part of code was taking time to load using Network option in developer tools:
  • Select web developer tools in firefox
  • Then select network

We identified one of the GET calls was taking time to load.
Then when this thing was reported to AWS support team they provided further analysis of this. We can save the report as (.HAR) file which tells us below things:

  • How long it takes to fetch DNS information
  • How long each object takes to be requested
  • How long it takes to connect to the server
  • How long it takes to transfer assets from the server to the browser of each object.

Troubleshooting using Traceroute

Then we tried to troubleshoot the AWS network flow using “tracert ” with below output:
Tracing route to example.gov [151.x.x.x] over a maximum of 15 hops:

1 <1 ms <1 ms <1 ms 10.x.x.x
2 * * * Request timed out.
3 * * * Request timed out.
4 * * * Request timed out.
5 * * * Request timed out.
6 * * * Request timed out.
7 <1 ms <1 ms <1 ms 100.x.x.x
8 <1 ms <1 ms 1 ms 52.x.x.x
9 * * * Request timed out.
10 2 ms 1 ms 1 ms example.net [67.x.x.x]
11 2 ms 2 ms 2 ms example.net [67.x.x.x]
12 2 ms 2 ms 2 ms example.net [205.x.x.x]
13 3 ms 3 ms 2 ms 63.x.x.x
14 3 ms 3 ms 3 ms 198.x.x.x
15 4 ms 4 ms 4 ms example.net [63.x.x.x]

And when this was reported to AWS team that RTO from 2-6 we were getting was due to connectivity with internal AWS network which needs to be byepass and was not an issue as packet still reached the next server within 1ms.
Traceroute gives an insight to your network problem.

  • The entire path that a packet travels through
  • Names and identity of routers and devices in your path
  • Network Latency or more specifically the time taken to send and receive data to each devices on the path.

Solution provided by AWS Team

After all the Razzle-Dazzle they just refreshed the network from their end and there was no more website latency after that while accessing from AWS internal network.

Tool recommended by AWS Support team for Network troubleshooting if the issue arises in future:

Wireshark along with .har file using network in web-developer tools from browser.

Wireshark is a network packet analyzer. A network packet analyzer will try to capture network packets and tries to display that packet data as detailed as possible.
You could think of a network packet analyzer as a measuring device used to examine what’s going on inside a network cable, just like a voltmeter is used by an electrician to examine what’s going on inside an electric cable (but at a higher level, of course).
In the past, such tools were either very expensive, proprietary, or both. However, with the advent of Wireshark, all that has changed.
Wireshark is perhaps one of the best open source packet analyzers available today.

Features

The following are some of the many features Wireshark provides:

  • Available for UNIX and Windows.
  • Capture live packet data from a network interface.
  • Open files containing packet data captured with tcpdump/WinDump, Wireshark, and a number of other packet capture programs.
  • Import packets from text files containing hex dumps of packet data.
  • Display packets with very detailed protocol information.
  • Save packet data captured.
  • Export some or all packets in a number of capture file formats.
  • Filter packets on many criteria.
  • Search for packets on many criteria.
  • Colorize packet display based on filters.
  • Create various statistics.
… and a lot more!

Best practices of Ansible Role

Ansible Role

Best practices  


I have written many Ansible Roles in my career. But when I talk about the “Best Practice of writing an Ansible Role” half of them were non-considerable. When I started writing Ansible Roles, I wrote them with a thought as to just complete my task. This thought made me struggle as a “DevOps Guy” because of this practice I just have to write each and every Ansible Role again and again when needed. Without the proper understanding about the Architecture of Ansible Role, I was incapable of enjoying all the functionality which I could have used to write an Ansible Role where I was just using “command” and “shell”  modules.

Advantages of Best Practices
  • Completing the task using Full Functionality.
  • Vandalized Architecture helps to create Ansible roles as Utilities which can be used further using different values.
  • Applying best practices helps you to learn new things every day.
  • Following “Convention Over Configuration” makes your troubleshooting much easier.
  • Helps you to grow your Automation skills.
  • You don’t have to worry about the latest version or change in values ever.

I can talk about the Advantages of best practices continuously but you should understand it after using them. So now, Let’s talk about “How to apply them”.


First, we will understand the complete directory structure on Ansible Role:

  • Defaults: The default variables for the role are been stored here inside this directory. These variables have the lowest priority.
  • Files: All the static files are being stored here which are used inside the role.
  • Handlers: All the handlers are being used here not inside the Task directory. And automatically called upon from here.
  • Meta: This directory contains the metadata about your role regarding the dependencies which are being required to run this role in any system, so it will not be run until the dependencies inside it are not been resolved.
  • Tasks: This directory contains the main list of the tasks which needs to be executed by the role.
  • Vars: This directory has high precedence than defaults directory and can only be overwritten by passing them On the command line, In the specific task or In a block.
  • Templates: This directory contains the Jinja to template inside this. Basically, all the dynamic files are being stored here which can be variablized.


Whitespace and Comments
Generous use of whitespace and breaking things up is really appreciated. One very important thing is the use of comments inside your roles so that someone using your role in future could be able to easily understand it properly.


YAML format
Learn YAML format properly and use of indentation properly inside the document. Sometimes, when running the role gives the error for Invalid Syntax due to bad indentation format. And writing in proper Indentation makes your role look beautiful.


Always Name Tasks
It is possible to leave off the ‘name’ for a given task, though it is recommended to provide a description about something is being done instead. This name is shown when that particular task is being run.


Version Control
Use version control. Keep your roles and inventory files in git and commit when you make changes to them. This way you have an audit trail describing when and why you changed the rules that are automating your infrastructure.


Variable and Vaults
Since the variable contains sensitive data, so It is often easier to find variables using grep or similar tools inside the Ansible system. Since vaults obscure these variables, It is best to work with a layer of Indirection. This allows Ansible to find the variables inside the unencrypted file and all sensitive variables come from an encrypted file.
The best approach to perform is to start with a group_vars subdirectory containing two more subdirectories inside it naming “Vars” and “Vaults”. Inside “Vars”  directory define all the variable including sensitive variables also. Now, copy those sensitive variables inside “Vault” directory while using the prefix “vault_*” for the variables. Now you should adjust the variables in the “Vars” to point the matching “vault_*” variables using jinja2 syntax and ensure that vault file is vault encrypted.


Roles for multiple OS
Roles should be written in a way that they could be run on multiple Operating systems. Try to make your roles as generic as you can. But if you have created a role for some specific kind of operating system or some specific application, then try to explicitly define that inside the role name.


Single role Single goal
Avoid tasks within a role which are not related to each other. Don’t build a common role. It’s ugly and bad for readability of your role.


Other Tips:
  • Use a module if available
  • Try not to use command or shell module
  • Use the state parameter
  • Prefer scalar variables
  • Set default for every variable
  • If you have multiple roles related to each other than try to create a common variable file for all of them which will be called inside your playbook


  • Use “copy” or “template” module instead of “lineinfile” module


  • Make role fully variablized


  • Be explicit when writing tasks. Suppose, If you are creating a file or directory then rather defining src and destination, try to define owner, group, mode etc.


Summary:
  • Create a Role which could be used further.
  • Create it using proper modules for better understanding.
  • Do proper comments inside it so that it would be understood by someone else also.
  • Use proper Indentation for the YAML format.
  • Create your Role variables and also secure them using vault.
  • Create Single role for Single goal.


Git Inside Out

@page { margin: 2cm } h3.cjk { font-family: “Noto Sans CJK SC Regular” } h3.ctl { font-family: “Lohit Devanagari” } p { margin-bottom: 0.25cm; line-height: 115% } a:link { so-language: zxx }

Git Inside-Out

Man Wearing Black and White Stripe Shirt Looking at White Printer Papers on the Wall

Git is basically a file-system where you can retrieve your content through addresses. It simply means that you can insert any kind of data into git for which Git will hand you back a unique key you can use later to retrieve that content. We would be learning #gitinsideout through this blog
The Git object model has three types: blobs (for files), trees (for folder) and commits. 
Objects are immutable (they are added but not changed) and every object is identified by its unique SHA-1 hash
A blob is just the contents of a file. By default, every new version of a file gets a new blob, which is a snapshot of the file (not a delta like many other versioning systems).
A tree is a list of references to blobs and trees.
A commit is a reference to a tree, a reference to parent commit(s) and some decoration (message, author).
Then there are branches and tags, which are typically just references to commits.
Git stores the data in our .git/objects directory.
After initialising a git repository, it automatically creates .git/objects/pack and .git/objects/info with no regular file. After pushing some files, it would reflect in the .git/objects/ folder
OBJECT Blob

blob stores the content of a file and we can check its content by command
git cat-file -p
or git show

OBJECT Tree

A tree is a simple object that has a bunch of pointers to blobs and other trees – it generally represents the contents of a directory or sub-directory.
We can use git ls-tree to list the content of the given tree object

OBJECT Commit

The “commit” object links a physical state of a tree with a description of how we got there and why.

A commit is defined by tree, parent, author, committer, comment

All three objects ( blob,Tree,Commit) are explained in details with the help of a pictorial diagram.
Often we make changes to our code and push it to SCM. I was doing it once and made multiple changes, I was thinking it would be great if I could see the details of changes through local repository itself instead to go to a remote repository server. That pushed me to explore Git more deeply.
I just created a local remote repository with the help of git bare repository. Made some changes and tracked those changes(type, content, size etc).
Below example will help you understand the concept behind it.
Suppose we have cloned a repository named kunal:
Inside the folder where we have cloned the repository, go to the folder kunal then:
cd kunal/.git/
I have added content(hello) to readme.md and made many changes into the same repository as:
adding README.md
updating Readme.md
adding 2 files modifying one
pull request
commit(adding directory).
Go to the refer folder inside .git and take the SHA value for the master head:
This commit object we can explore further with the help of cat-file which will show the type and content of tree and commit object:

Now we can see a tree object inside the tree object. Further, we can see the details for the tree object which in turn contains a blob object as below:
Below is the pictorial representation for the same:
Pictorial Representation

More elaborated representation for the same :

Below are the commands for checking the content, type and size of objects( blob, tree and commit)
kunal@work:/home/git/test/kunal# cat README.md
hello
We can find the details of objects( size,type,content) with the help of #git cat-file
git-cat-file:- Provide content, type or size information for repository objects
You an verify the content of commit object and its type with git cat-file as below:

kunal@work:/home/git/test/kunal/.git # cat logs/refs/heads/master

Checking the content of a blob object(README.md, kunal and sandy)
As we can see first one is adding read me , so it is giving null parent(00000…000) and its unique SHA-1 is 912a4e85afac3b737797b5a09387a68afad816d6
Below are the details that we can fetch from above SHA-1 with the help of git cat-file :

Consider one example of merge:
Created a test branch and made changes and merged it to master.


Here you can notice we have two parents because of a merge request

You can further see the content, size, type of repository #gitobjects like:


Summary


This is pretty lengthy article but I’ve tried to make it as transparent and clear as possible. Once you work through the article and understand all concepts I showed here you will be able to work with Git more effectively.
This explanation gives the details regarding tree data structure and internal storage of objects. You can check the content (differences/commits)of the files through local .git repository which stores each object with unique  SHA  hash. this would clear basically the internal working of git.
Hopefully, this blog would help you in understanding the git inside out and helps in troubleshooting things related to git.

Design a site like this with WordPress.com
Get started